USA Housing Market Analysis
But what tools do we have to understand if the US real estate market is really a worthwhile place to invest?
As in any sector, to begin to understand the news, we must analyze the facts.
This real estate market was characterized between 2001 and 2006 by a rapidly rising price step that led to the so-called “bubble” that exploded in 2007 and triggered by the sub-prime mortgage crisis.
But this was not the first bubble and, probably, it will not be the last one.
The data for our analysis can be derived from the American Housing Prices Index, created by Yale Robert J. Shiller’s economist. In this index, the sales prices of existing homes have been included since 1890, deliberately excluding the new constructions, and allows you to check the value of your investment over time, net of inflation.
Reading the resulting graph, it is immediately understood that, like all the extremely vital markets, this has often been characterized by cyclical trends with very pronounced peaks (eg, 1979, 1990, 2006) followed by periods of correction more or less long.
Since 2012, prices have started to rise again and this could lead to a new upswing in the coming years. According to data released by ReMax National Housing Report in October 2013, average prices rose by 11.9% compared to the 2.2% annual growth rate of transactions.
The most encouraging figure to understand the definitive reversal of the negative trend is however given by the fact that today they spend on average about 2 months since an apartment is sold for when it is actually sold.
Another useful element to see whether a market is whether or not to buy a property is given when the house price index falls below the owner equivalent rent index. Since 2009, the values of the two indices in the US have begun a kind of ballet that leads them to cross more and more often. Suffice it to think that by buying in this favorable economic climate for the next sharp price hike, it will be in the front row to make the market again favor investors who bring the property to income.
Lastly, banks also saw this trend reversal in price trends and tested it by increasing the forcing procedures (foreclosures) by up to 12% in May 2013, while in the 5 months preceding this practice it had always been plus counting in absolute numbers. The objective of lenders is to maximize and realize the value of price-priced properties. In the previous year it is estimated that banks have reduced the number of homes owned by up to 12%.
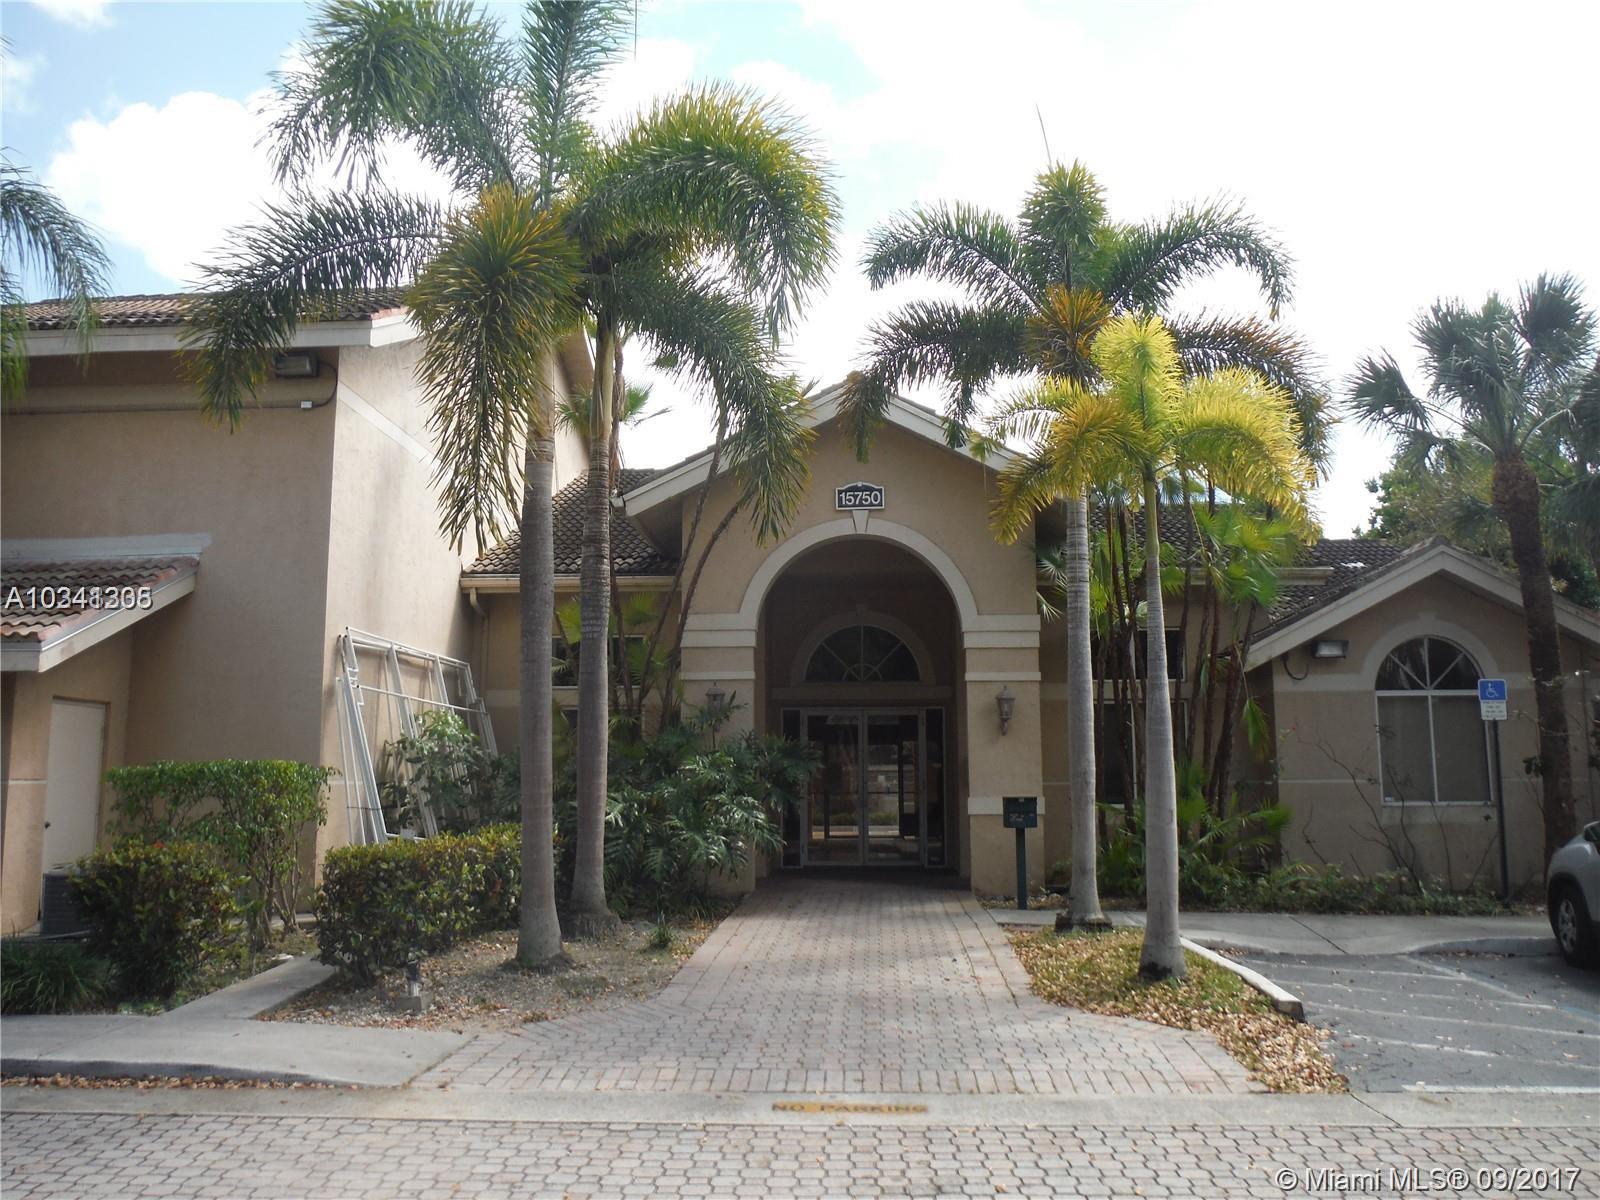
Miami, in a year (September 2012 / September 2013) has seen a rise in real estate prices even by 14%!